Start with the measurement, not the headline
The channel’s July 2026 YouTube Studio overview shows 8,689 views for July 1–31. A later Studio overview shows 6,083,084 views in the last 28 days, with the companion Shorts screenshot dated August 18–September 14, 2026. “8.7K to 6M+” is a readable label for those two observations. It is not a same-window experiment, and I do not treat it as a like-for-like percentage lift.
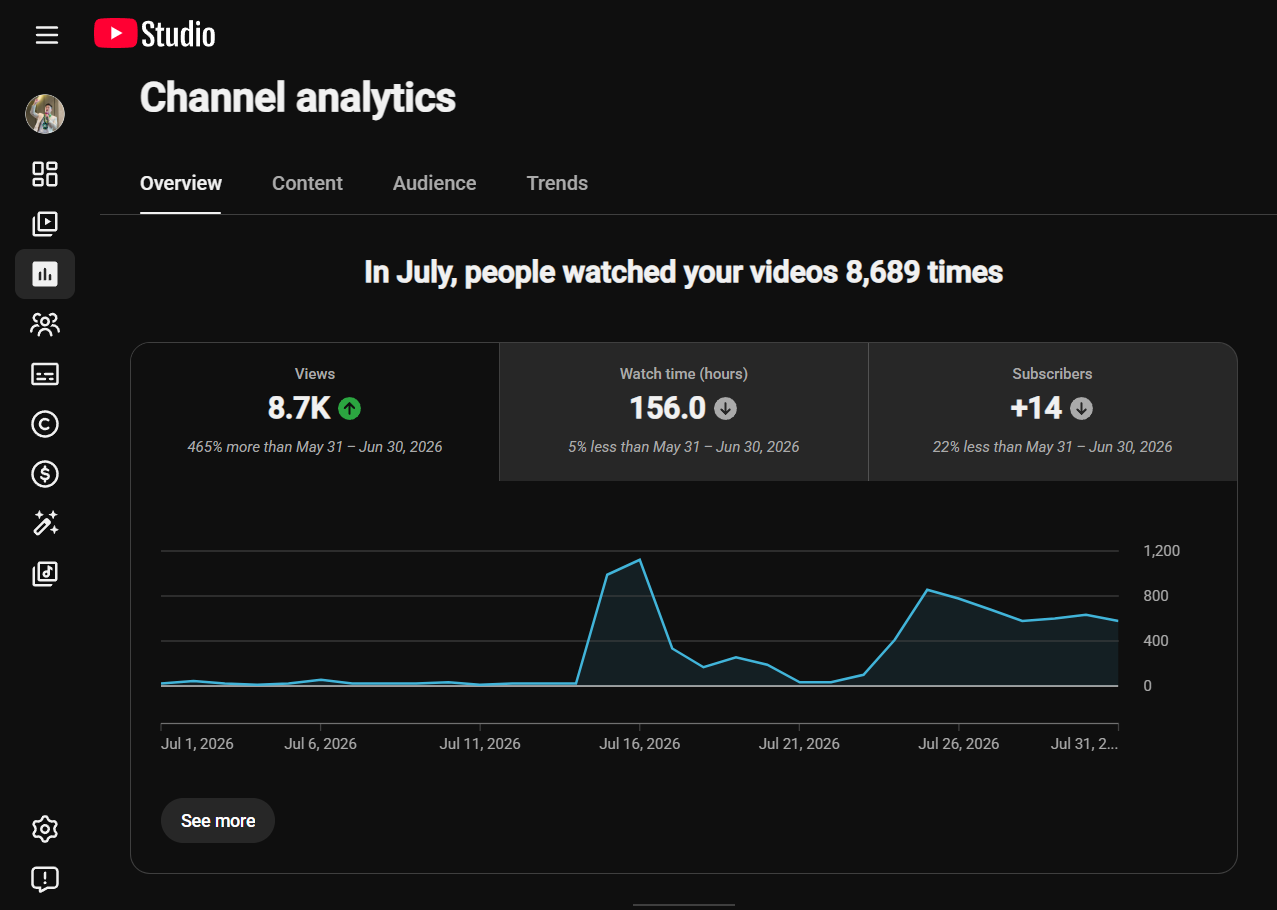
The existing case study says I began active management on August 5 and changed how content was selected, packaged, scheduled, and reviewed. That account describes the work; the screenshots independently document the displayed channel metrics. They do not reveal every editorial decision or isolate its effect from other causes.
The publishing loop I changed
The operational problem was not simply upload volume. The case study describes a weak connection between the content chosen for YouTube, the opening presentation, the release cadence, and what the next upload learned from audience response. I organized the work as a loop rather than a series of disconnected posts.
- Select: choose ideas and formats with a clear reason to be watched by the channel’s audience, instead of moving content over unchanged from another platform.
- Package: make the opening visual, hook, title, and framing understandable in YouTube’s viewing context. This is an editorial decision, not a claim to know a secret recommendation formula.
- Publish: keep a repeatable cadence so there is a reliable sequence of releases to inspect. The available material documents a consistent schedule, but does not prove an optimal posting frequency.
- Read the response: use Studio’s retention and engagement signals to decide which questions the next release should test. The goal is to learn from specific uploads, not to explain every view after the fact.
That loop is the transferable method. It could be adopted by a smaller channel without promising the same outcome. Selection and packaging hypotheses should be written down before results arrive; otherwise, it is too easy to label any success as evidence that the entire strategy worked.
What the later window shows
The overview and Shorts tabs report different measures for the later 28-day span. The exact counts and rounded K/L values below are displayed by Studio; they are not numbers to add together. YouTube’s Shorts analytics guidance describes the separate content measures.
| Metric | Displayed value | Window / view |
|---|---|---|
| Channel views | 8,689 (exact) | July 1–31, 2026 · Overview |
| Channel views | 6,083,084 (exact) | Aug 18–Sep 14, 2026 · Overview |
| Watch time | 18.9K hours (rounded) | Same later Overview |
| Shorts views | 60.7L (rounded) | Aug 18–Sep 14, 2026 · Shorts |
| Engaged views | 29.9L (rounded) | Same Shorts view |
| Likes | 1.5L (rounded) | Same Shorts view |
In the screenshot’s locale, 60.7L is approximately 6.07 million; 29.9L is 2.99 million; and 1.5L is 150,000. The Shorts screenshot is also available in the case study.
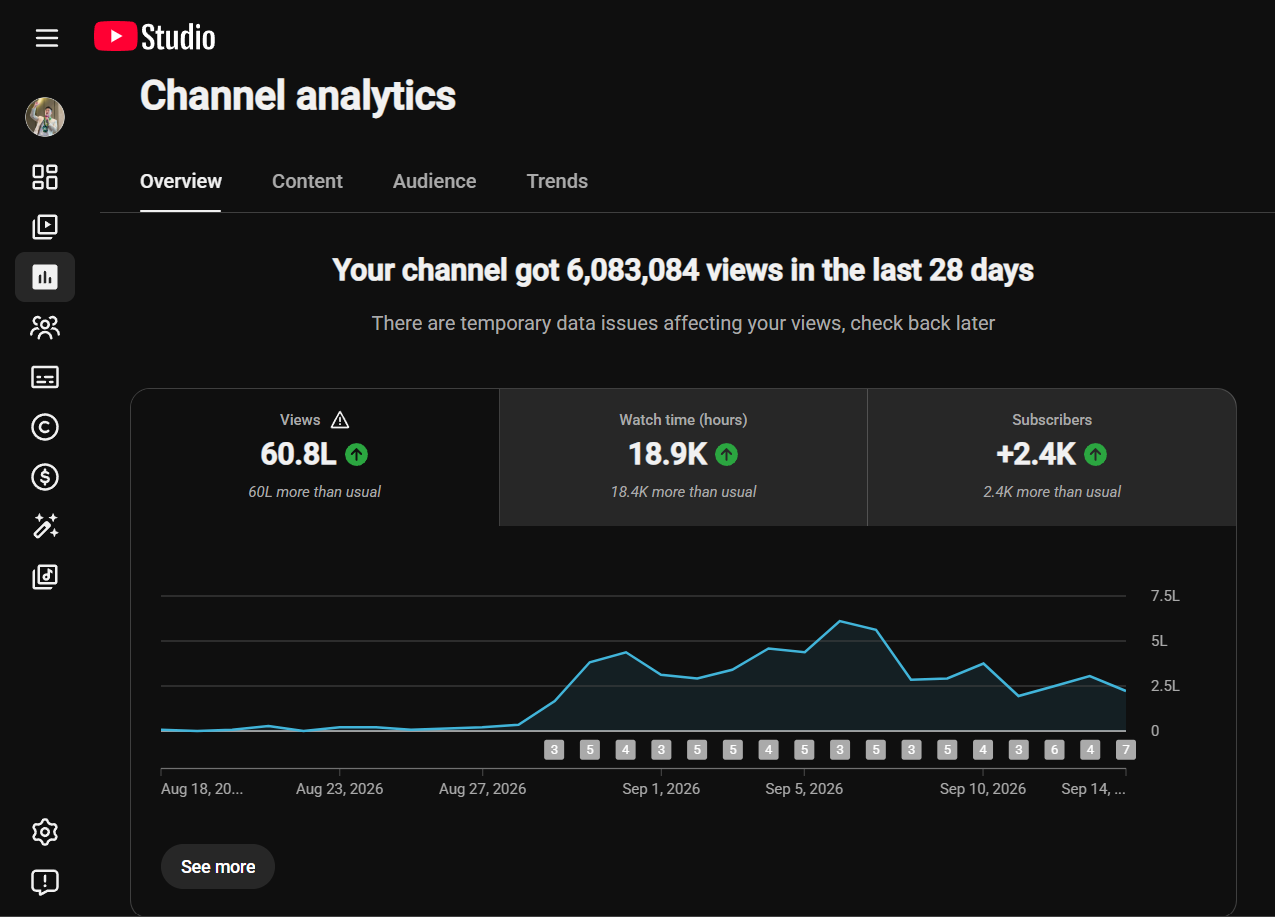
The warning matters. The overview screenshot says temporary data issues were affecting views and to check back later. I retain the displayed figure as a dated observation, not as an immutable audited total. Without a later reconciled export, I cannot claim the final corrected number.
What this does and does not prove
The timing is consistent with an improved publishing system and a substantially larger later audience response. It does not provide a randomized control, a full content-level dataset, or a counterfactual showing what would have happened without the changes. It also does not establish that any one hook, title, upload time, or algorithmic signal caused the result.
For the next analysis, I would preserve an upload-level log: content choice, packaging hypothesis, publish date, early retention, engaged views, and the specific change made next. Then I would compare like-for-like windows and formats, and note whether outliers dominate the totals. That would turn a persuasive before-and-after account into a more useful operating record.
A result can be real and still leave the mechanism partly uncertain. The honest response is to keep measuring.
Sources and scope
- YouTube distribution case study for the described intervention and chronology.
- Existing YouTube Studio screenshots shown above, plus the Shorts analytics screenshot in the case study, for the displayed metrics and date windows.
- YouTube Shorts analytics help for metric context.